
Figure 10.
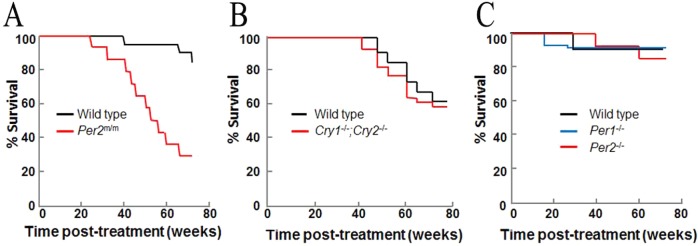
Kaplan–Meier plots of death from cancer from three different studies of mice with clock gene mutations. Eight-week-old mice of the indicated genotypes were exposed to 4 Gy of IR at ZT10 and observed for 90 weeks. Data for tumorigenesis and mortality are replotted from (A) ref (29) (B) ref (91), and (C) ref (92).