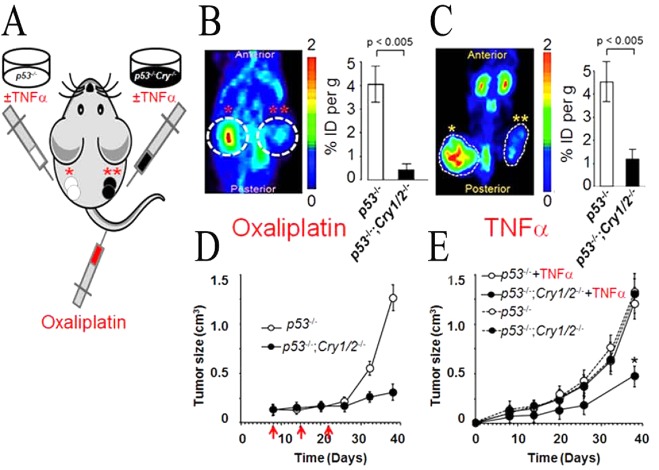
Figure 12.
Cry mutation increases the efficacy of cancer treatment by chemotherapy and immunotherapy. (A) Diagram of the NOD/SCID mouse bearing a p53–/– tumor xenograft on the left flank (one asterisk) and a p53–/–;Cry1/2–/– tumor xenograft on the right flank (two asterisks). (B and C) Effect of oxaliplatin and TNFα on tumor growth (metabolism). (B) In the chemotherapy experiment, following xenograft growth to 0.1 cm3 the mouse was treated with oxaliplatin. (C) In the case of the biotherapy experiment, the transformed cells were treated with TNFα before injection. Tumor metabolism was measured either 38 days (oxaliplatin) or 40 days (TNFα) after xenograft injection. Colored panels show micro PET scans, and charts at the right show quantification of the [18F]FDG signal as the ratio of the percent injected dose (%ID) within the circled area to the %ID in the background region. (D) Plot of tumor growth with red arrows indicating days of oxaliplatin injection following the xenograft injection on day 0.72 (E) Plot of tumor growth following injection of TNFα-treated transformed cells.

