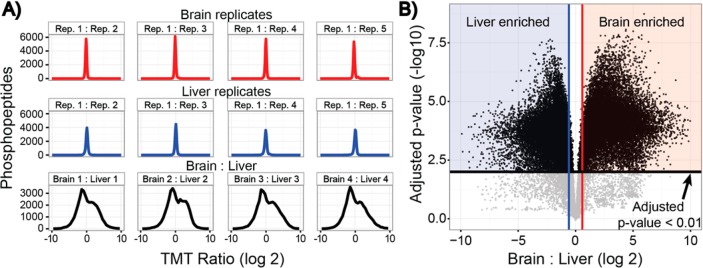
Figure 5.

(A) Biological replicates were assessed for reproducibility. One biological replicate from brain (red) and liver (blue) was compared to all other biological replicates. The tight distributions of ratios centered about 0 (log 2) indicated good reproducibility. In contrast, ratios of brain to liver (black) display a wide distribution, highlighting the phosphoproteome diversity between the tissues. (B) Reproducible and accurate measurements across all 10 samples permitted the stringent filtering of tissue-enriched phosphopeptides. Liver (blue) and brain (red) enriched phosphopeptides were identified through a Welch’s corrected t test. Vertical lines (blue and red) represent a 1.5-fold change in expression. In all, 83% of phosphopeptides were significantly enriched in the liver or brain (adjusted p-value < 0.01).
