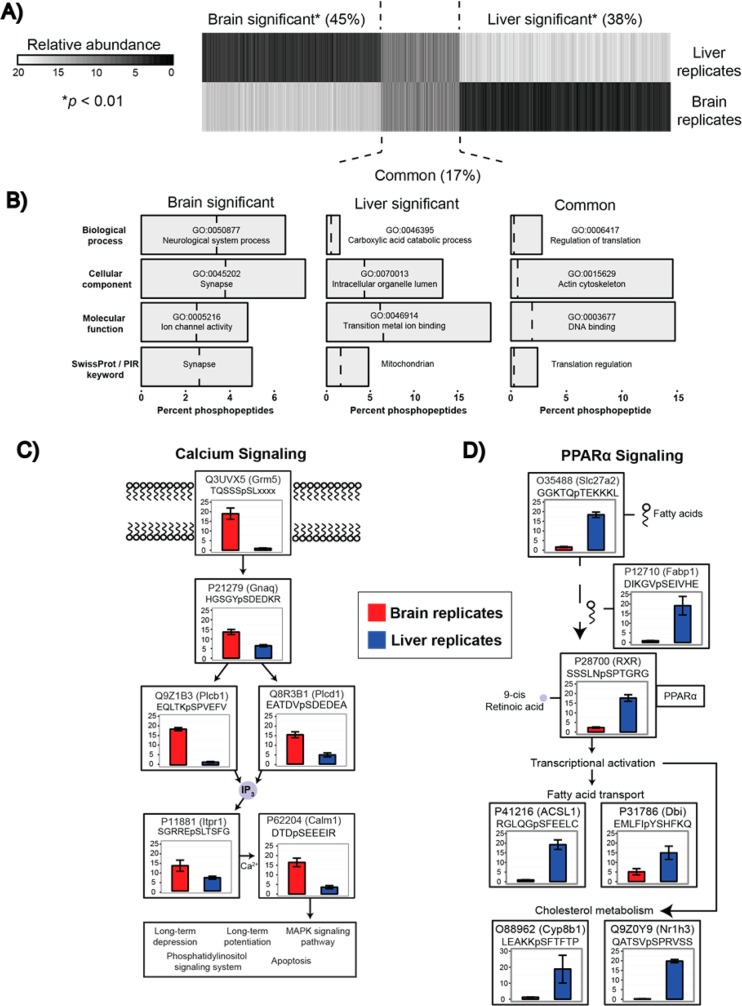
Figure 6.
(A) Relative abundances of 38 247 phosphopeptides from quintuplicate biological replicates of mouse livers and brains were plotted. Statistical comparison (t test, adjusted p-values < 0.01) provided three clusters representing phosphopeptides enriched in the brain, the liver, or those that were commonly expressed in both tissues. (B) GO term enrichment was performed on each cluster resulting in descriptive terms consistent with the originating tissue. The dashed line represents the term frequency across all phosphopeptides. (C,D) Tissue specific pathways highlight the phosphopeptide coverage and quantitative reproducibility of the sample preparation and method.

