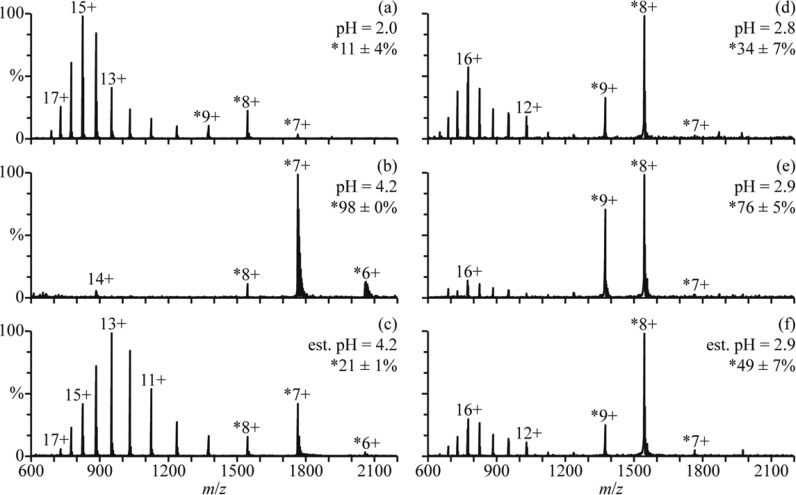
Figure 5.
Mass spectra of (a) cyt c in an aqueous solution of 2.5% formic acid (pH = 2.0), (b) this formic acid solution mixed with a 500 mM aqueous ammonium acetate solution at a 1:1 ratio (pH = 4.2), and (c) this formic acid solution mixed with the ammonium acetate solution using a theta-glass emitter (estimated pH = 4.2). Mass spectra of (d) cyt c in an aqueous solution of 1.0% acetic acid (pH = 2.8), (e) this acetic acid solution mixed with water at a 1:1 ratio (pH = 2.9), and (f) this acetic acid solution mixed with water using a theta-glass emitter (estimated pH = 2.9). Percentages are the relative abundances of the fraction of cyt c in charge states corresponding to folded conformers (denoted with ∗).

