Figure 2.

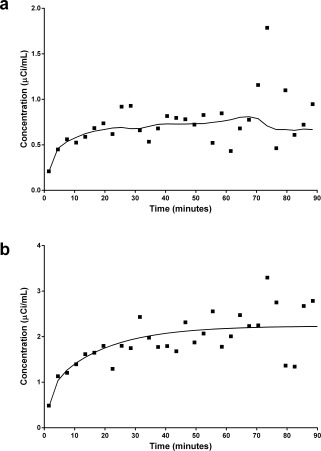
Single PET voxel rest data (a) with fitted curve using MRTM in ventral striatum region (solid line) and single voxel level‐simulated rest data (b) with true value (solid line).

Single PET voxel rest data (a) with fitted curve using MRTM in ventral striatum region (solid line) and single voxel level‐simulated rest data (b) with true value (solid line).