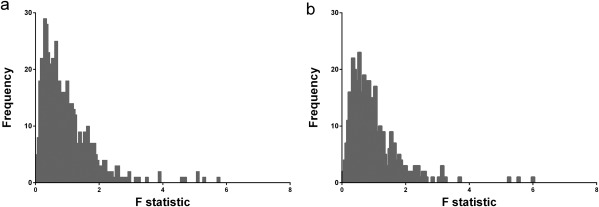
Figure 3.

Distribution of F‐ratio based on (a) simulated rest data and (b) real‐rest PET data in human subject. F‐ratios are generated at each voxel in dorsal striatum by comparing the weighted residual sum of squares of the lp‐ntPET fit to that of the MRTM fit to the same TAC.
