Figure 11.

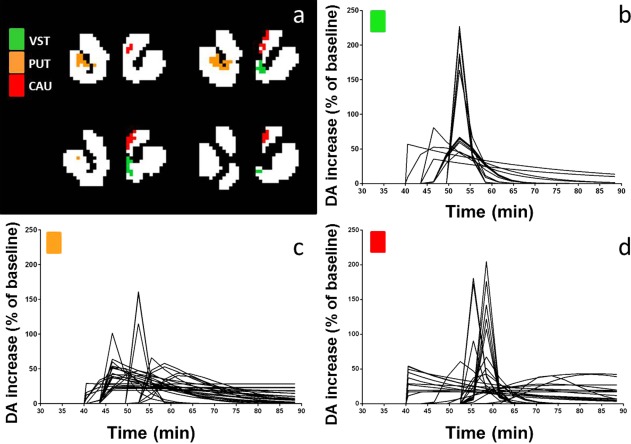
DA response curves for each voxel in each significant cluster (b–d) in four different slices through the striatum (a) in one subject's smoking scan (VST, ventral striatum; PUT, putamen; CAU, caudate).

DA response curves for each voxel in each significant cluster (b–d) in four different slices through the striatum (a) in one subject's smoking scan (VST, ventral striatum; PUT, putamen; CAU, caudate).