
Figure 12.
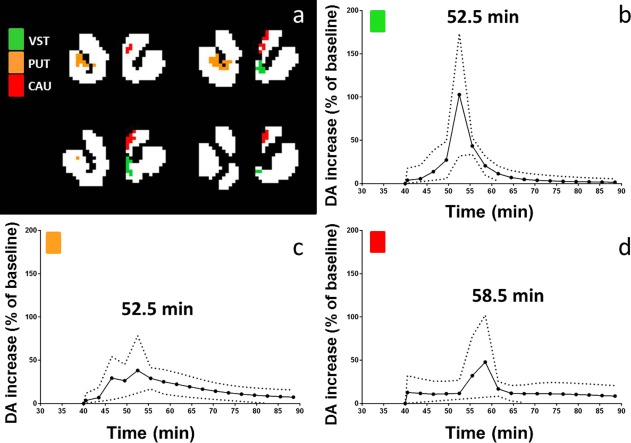
Average DA curves in the significant clusters of one subject's smoking scan. Solid curves represent the mean of the data curves in Figure 11, and the dotted curves represent the mean + SD and the mean − SD, respectively.
Official websites use .gov
A
.gov website belongs to an official
government organization in the United States.
Secure .gov websites use HTTPS
A lock (
) or https:// means you've safely
connected to the .gov website. Share sensitive
information only on official, secure websites.
Average DA curves in the significant clusters of one subject's smoking scan. Solid curves represent the mean of the data curves in Figure 11, and the dotted curves represent the mean + SD and the mean − SD, respectively.