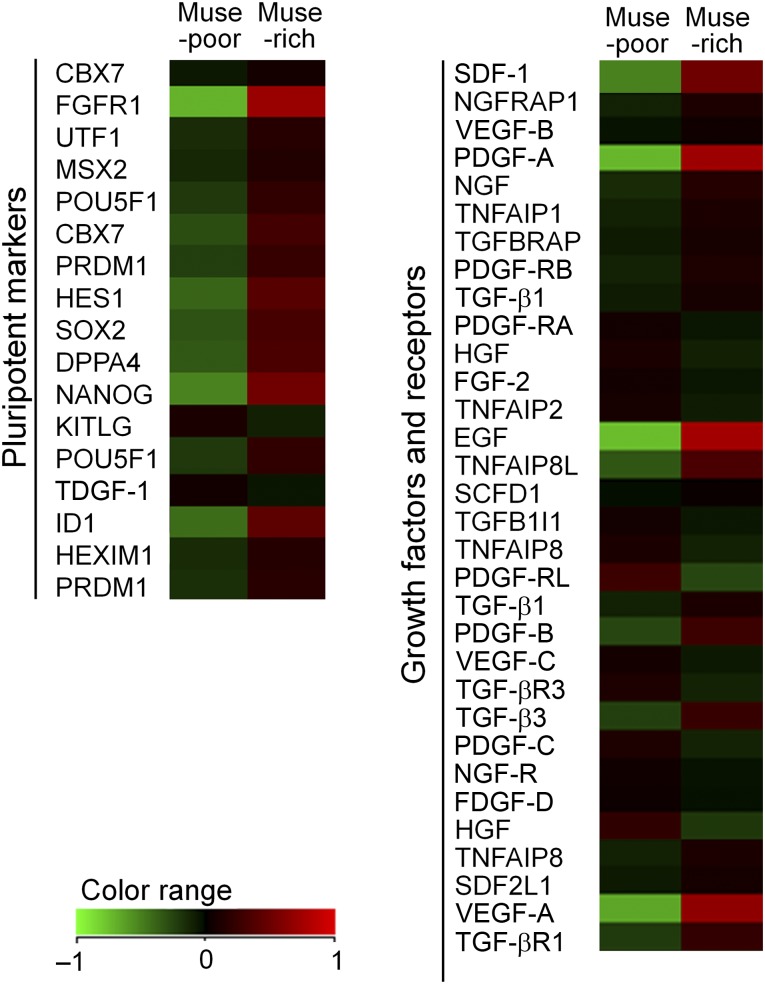
Figure 4.
Microarray analyses of Muse-rich and Muse-poor cell populations. Heat maps for pluripotent markers, growth factors, and receptors indicate that pluripotent markers, including NANOG and FGFR1, were upregulated in the Muse-rich population compared with the Muse-poor population. The Muse-rich population also showed higher gene expression of growth factors such as PDGF-A, EGF, and VEGF-A (supplemental online Figure 1). Abbreviations: EGF, epidermal growth factor; FGFR1, fibroblast growth factor receptor 1; HGF, hepatocyte growth factor; Muse, multilineage-differentiating stress-enduring; NGF, nerve growth factor; PDGF-A, platelet-derived growth factor-A; SDF-1, stromal cell-derived factor 1; TGF, transforming growth factor; VEGF, vascular endothelial growth factor.

