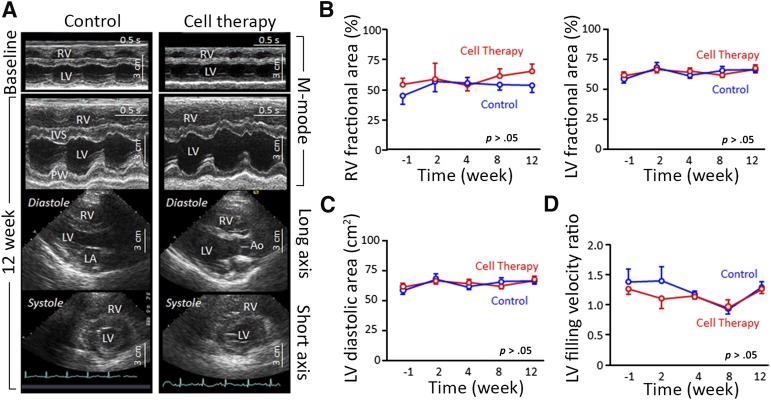
Figure 5.
Echocardiography studies show that autologous cell-therapy injection into the porcine right ventricle is safe. (A): Echocardiography images at baseline (M-mode) and at 12-week follow-up [M-mode and two-dimensional echocardiography views (long axis and short axis for the systolic phase)], with a normal electrocardiography record in both study groups. The left column represents the control animal group, and the right column represents the cell-therapy group. The images did not differ between groups. (B–D): There were no significant statistical differences (p > .05) between control (blue curves) and cell-therapy group (red curves) at −1, 2, 4, 8, and 12 weeks of follow-up of thoracotomy on the right and left ventricle fractional area change (B), on the left ventricle diastolic area (C), and on the early to late left ventricle filling velocity ratio (D). Abbreviations: Ao, aortic artery; IVS, interventricular septum; LA, left atrium; LV, left ventricle; PW, posterior wall; RV, right ventricle.

