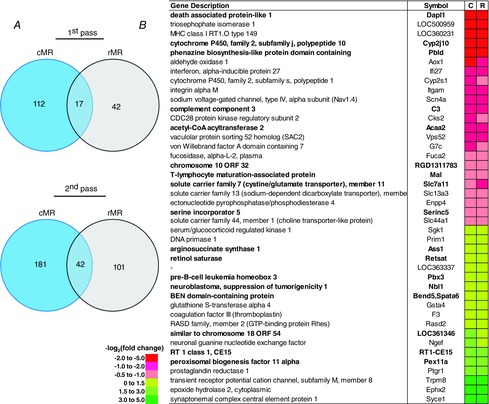
Figure 7.

Fewer genes are differentially expressed between strains and common to the cMR and rMR
A, Venn diagrams displaying known genes in cMR (blue) or rMR (grey) regions differentially expressed between the BN and SS strains, and those common to both regions (overlap) using first pass (q < 0.05; left) or second pass (q < 0.25; P < 0.005) statistical criteria. B, list of known genes differentially expressed among strains common to both regions, where relative abundance [−log2(fold change)] in the BN is lower (red/pink) or higher (yellow/green) compared to the SS. First pass genes are bold in (B). cMR, caudal medullary raphé; rMR, rostral medullary raphé.
