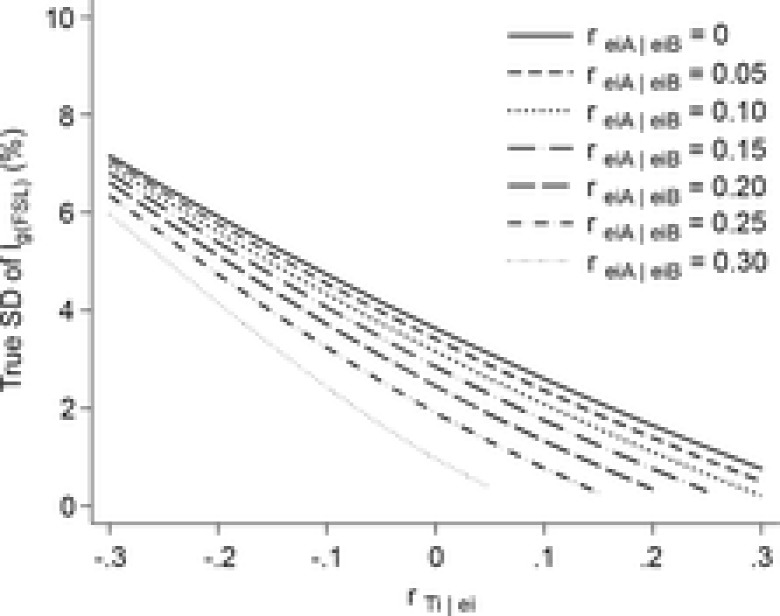
Figure A1.

Sensitivity analysis
Sensitivity analysis showing the relationship between estimates of the variability (SD) of muscle lengths at which fascicles fall slack and the two error correlations,  and reiA|eiB. There was little variability in the muscle lengths at which fascicles fall slack (SD < 7.2%) across the ranges of plausible correlations (−0.3 <
  , and 0 < reiA|eiB < 0.3).
