
Figure 4.
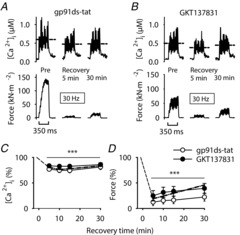
The decreases in SR Ca2+ release and force during PLFFD in the presence of NOX2 or NOX4 inhibitors are similar to those in control
Representative records of [Ca2+]i (upper row) and force (lower row) from muscle fibres stimulated with 30 Hz, 350 ms tetani while being superfused by standard Tyrode before fatiguing stimulation (Pre) and subsequently exposed to the NOX2 inhibitor gp91ds-tat (5 μm; A) or the NOX4 inhibitor GKT137831 (4 μm; B) during fatiguing stimulation and recovery. Dashed horizontal lines show averaged [Ca2+]i during stimulation periods. C and D show mean data (± SEM) of 30 Hz [Ca2+]i and force, respectively, at 5 to 30 min after fatigue in the presence of gp91ds-tat (○, n = 8) or GKT137831 (•, n = 8); for comparison, mean values from control fibres are also shown (dashed–dotted line; data from Fig. 3). Data are expressed relative to pre-fatigue values, which were set to 100%. ***P < 0.001 vs. pre-fatigue values with repeated measures ANOVA.