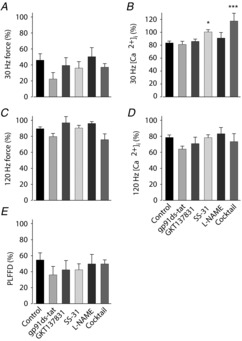
Figure 9.

Markedly increased [Ca2+]i during 30 Hz contractions in fibres exposed to the antioxidant–NOS inhibitor cocktail
Relative force and [Ca2+]i during 30 Hz (A and B) and 120 Hz (C and D) contractions produced 30 min after fatiguing stimulation; data expressed relative to pre-fatigue value in each fibre. E, PLFFD calculated as the 30/120 Hz force ratio at 30 min recovery divided by the pre-fatigue ratio. Groups defined below panels D and E. Data are means ± SEM.*P < 0.05 and***P < 0.001 vs. control fibres (one-way ANOVA).
