
Figure 2.
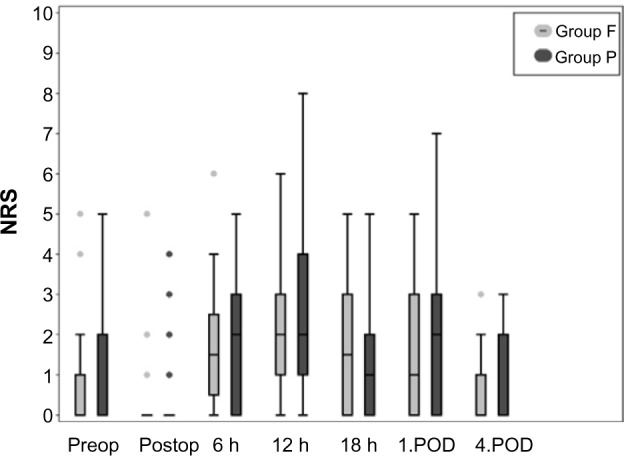
Box plot of NRS pain scores in the fentanyl and placebo groups over time.
Notes: The top and bottom of the boxes indicate the upper and lower quartiles, and the horizontal line in the box shows the median. Whiskers from the box indicate the most extreme value less than or equal to1.5 interquartile ranges. Outliers (individual values more than 1.5 interquartile ranges) are shown with dots.
Abbreviations: NRS, numerical rating scale; Preop, preoperative; Postop, postoperative; 1.POD, first postoperative day; 4.POD, fourth postoperative day; Group F, transdermal fentanyl; Group P, placebo; h, hours.