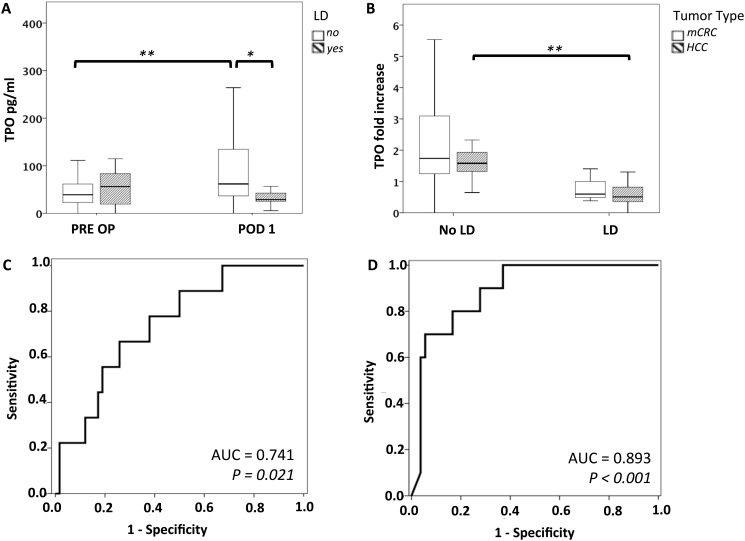
Figure 3. Perioperative TPO dynamics predict postoperative LD.
Pre- and postoperative TPO levels are illustrated to demonstrate perioperative TPO changes in patients with or without postoperative LD (A). To reflect perioperative TPO dynamics the ratio of pre- to postoperative TPO levels was calculated (postoperative TPO: preoperative TPO). B illustrates fold increase in plasma TPO according to tumor type and liver dysfunction. Further ROC analysis was performed for LD and absolute levels of TPO on POD 1 (C) as well as relative TPO increase (D). * P < 0.05; ** P < 0.005.

