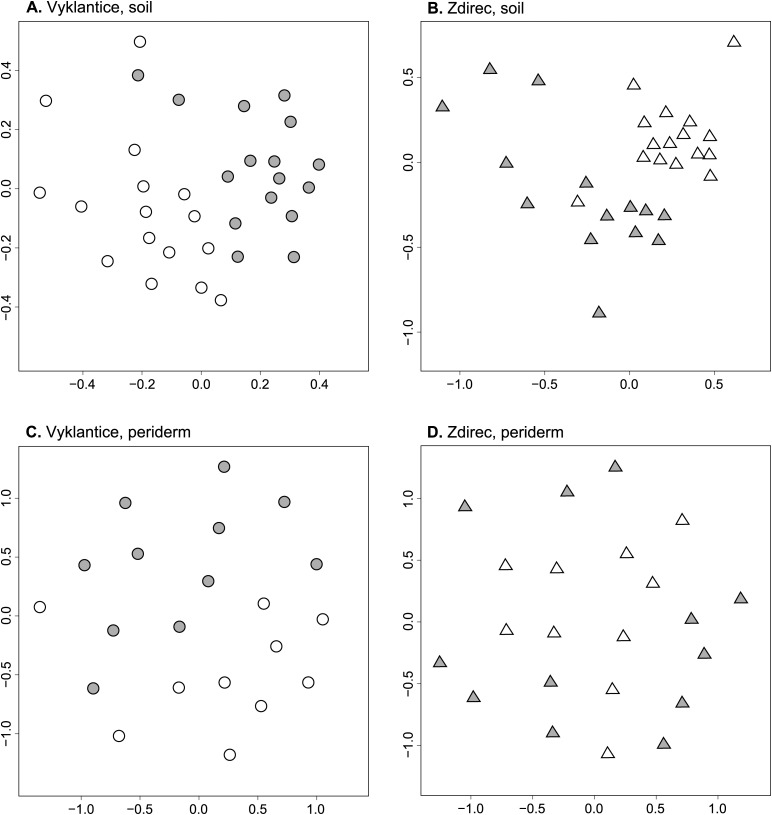
Figure 1. T-RFLP profiles of the communities of actinobacteria sampled at Vyklantice and Zdirec experimental sites from tuberosphere soil (A,B) and potato periderm (C,D).
Sammon’s multidimensional scaling was based on Manhattan distance matrices calculated for the baseline filtered and normalized T-RFLP profiles. The symbols represent the profiles of actinobacteria at the fields with low (open symbols) and high (closed symbols) common scab severity.

