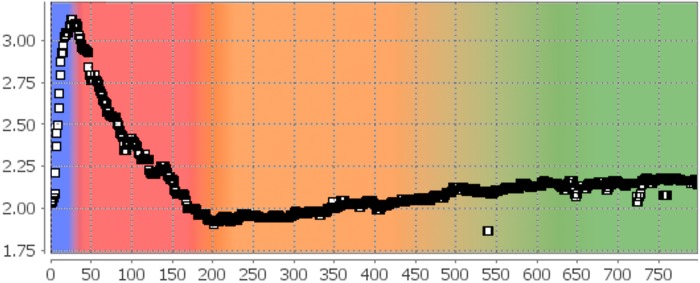
Figure 5. Skewness of the Difference Images in the Proof-of-Principle Analysis.

From the histograms of the absolute image differences, statistical parameters like energy, entropy, skewness, and kurtosis were determined. The figure shows the plot of the skewness taken from the Viewport of IQM. Phases I (blue) and II (red) are clearly distinguishable: During phase I the skewness rises steeply reaching a maximum at the transition to phase II at about frame #20. During phase II, the skewness is decreasing and reaches a minimum at the transition to phase III (orange) at about frame #200. The transition from phase III to phase IV (green) could not be detected with this approach.
