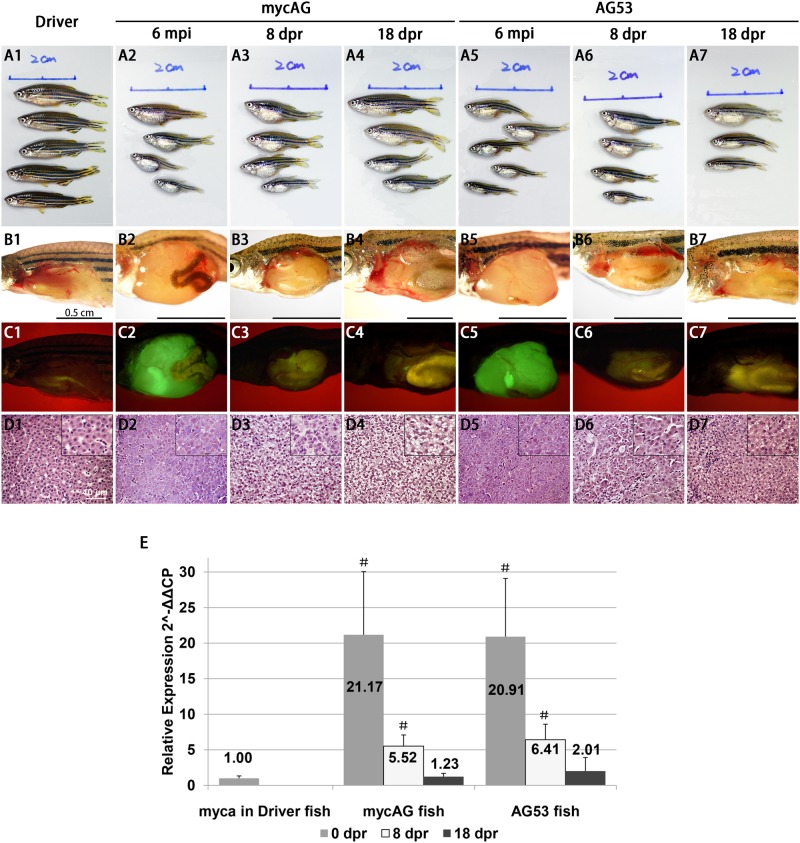
Figure 6. Tumor regression in mycAG fish and AG53 fish after mifepristone withdrawal.
Mifepristone was withdrawn at 6 mpi (7 mpf), MycAG line and AG53 fish were sampled at 0 dpr, 8 dpr and 18 dpr for gross observation and histological examination, (A1–A7) Exterior observation of each phenotype. (B1–B7) Gross observation of liver tumors after removal of abdominal wall. (C1–C7) The same views as those in (B1–B5) for observation of GFP expression that illustrate the shape of livers. (D1–D7) H&E staining of liver sections. Larger magnifications are shown in insets. (E) MycAG mRNA level in 0-dpr, 8-dpr and 18-dpr liver samples as quantified by RT-qPCR. Each group had three biological replicates. # indicates significant difference (P<0.05) when compared with myca expression in the Driver.

