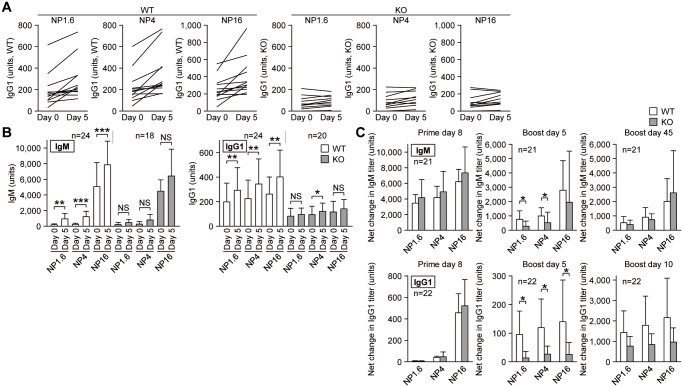
Figure 3. The secondary NP-specific antibody response is impaired in CDH17-/- mice.
CDH17-/- mice and their WT littermates received a primary immunization with NP-CGG in alum. Mice were boost immunized (without alum) 50 weeks later. Serum titers of anti-NP IgM and IgG1 antibodies were measured in an ELISA. (A) The changes in NP-specific serum IgG1 titer in individual mice are plotted on a line graph (titers are expressed as described in the legend to Fig. 2). The horizontal axis shows the day of blood sampling (Day 0 = the day of boost; Day 5 = 5 days post-boost). Each line represents an individual mouse. (B) The average titers of NP-specific serum IgM (left) and IgG1 (right) calculated from the data shown in (A) are plotted on a bar graph. Statistical significance was calculated using a paired Student’s t-test (n = 24 (WT, IgM); n = 18 (KO, IgM); n = 24 (WT, IgG1); n = 20 (KO, IgG1)). (C) The net increment of NP-specific serum IgM titers (top) and IgG1 titers (bottom) after the primary immunization (left) and boost immunization (middle, 5 days after the boost; right, 45 days after the boost) was calculated by subtracting the pre-immune (left) or pre-boost (middle and right) serum titers (n = 24 (WT, IgM); n = 24 (WT, IgG1); n = 18 (KO, IgM); n = 20 (KO, gG1)). NS, not significant (P>0.05). *P≤0.05, **P≤0.01, ***P ≤0.001.

