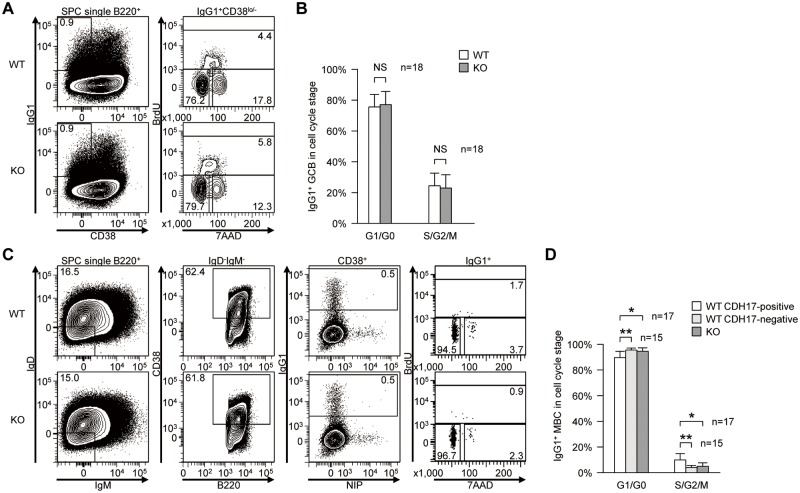
Figure 5. CDH17+ switched IgG1+ MBCs show increased cell cycle progression.
(A) Cell cycle of IgG1+ GCB cells (B220+IgG1+CD38lo/-) from CDH17-/- mice and their WT littermates were analyzed by flow cytometry. Numbers indicate the percentage (%) of cells in their respective cell cycle gates (lower left, G0/G1 phase; top, S phase; lower right, G2/M phase). (B) The percentages of the GCB cell population in each indicated cell cycle stage are plotted on a bar graph (n = 18; NS, not significant (P>0.05; Mann-Whitney U-test)). (C) Cell cycle of switched IgG1+ MBCs (B220+IgD-IgM-CD38+IgG1+) from CDH17-/- mice and WT littermates were analyzed by flow cytometry. The numbers indicate the percentage of cells in the respective cell cycle gates. (D) The percentages of switched IgG1+ MBCs at the indicated cell cycle stage are plotted on a bar graph (n = 15–17; NS, not significant (P>0.05). *P≤0.05, **P≤0.01 (Mann-Whitney U-test).

