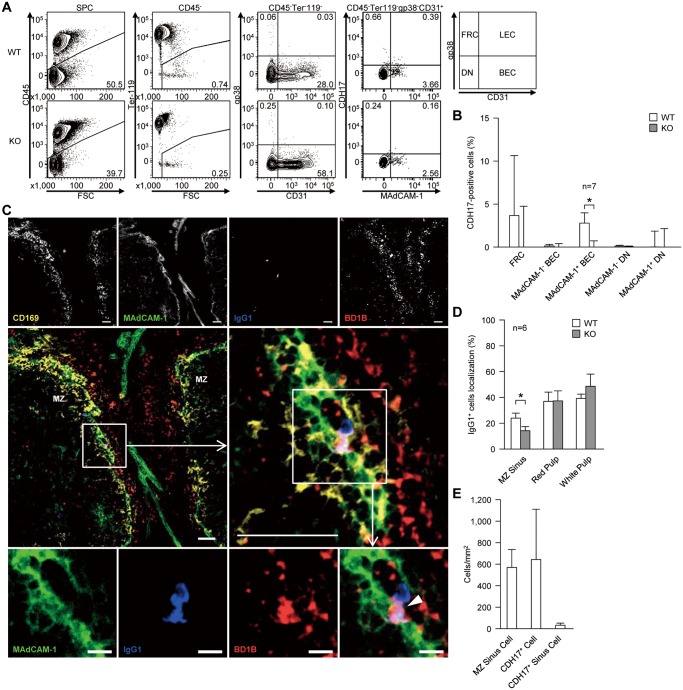
Figure 6. A fraction of BEC is CDH17+.
(A) Spleens were treated with dispase and collagenase IV to obtain single stromal cells, and cell surface markers were analyzed by flow cytometry. Stromal cells were separated into four subpopulations: fibroblastic reticular cells (FRCs, gp38+CD31-), lymphatic endothelial cells (LEC, gp38+CD31+), BEC (gp38-CD31+), and double-negative (DN) cells (far right panel). Each fraction was then tested for CDH17 expression. The numbers adjacent to the gates indicate the percentage (%) of the indicated cells within their respective parental gates (shown on top of each panel). (B) The percentages of CDH17+ stromal cells within the respective parental gates are plotted on a bar graph. The percentages were calculated by subtracting the values of KO mice from those of WT mice (n = 7 (MAdCAM-1+ BEC); n = 8 (others)). *P≤0.05 (Student’s t-test). (C) WT mouse spleen was stained with anti-CD169 (yellow), anti-MAdCAM-1 (green), anti-mouse IgG1 (blue), anti-CDH17 (red, BD1B), and analyzed by confocal microscopy. The middle-right micrograph is an enlarged view of the boxed area shown in the middle-left micrograph. The bottom row of images shows each separate color channel and an expanded view of the merged image shown within the box in the middle-right panel. The white arrowhead shown in the bottom right image indicates an IgG1+ cell that is adjacent to a CDH17+ cell in the MZ sinus. Data are representative of three independent experiments. Scale bars, 50 μm (top and middle row of images) or 10 μm (bottom row). (D) The localization of IgG1+ cells in the MZ, red pulp, and white pulp in WT and KO mice are plotted on a bar graph. Values are expressed as the percentage of IgG1+ cells localized within each sub-region of the spleen (n = 6; *P≤0.05 (Student’s t-test)). (E) The number of MZ sinus (MAdCAM-1+) cells, CDH17+ cells, and CDH17+ MZ sinus cells (Cdh17+MAdCAM-1+) in the spleen of WT mice are plotted on a bar graph. Cell numbers were counted in six histological sections of WT spleen. The mean and standard deviation are plotted.

