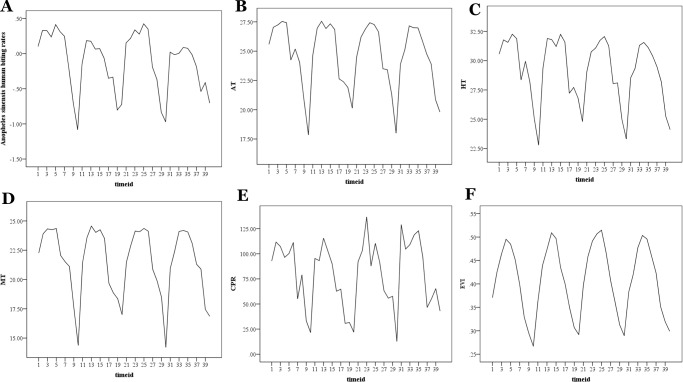
Figure 2. Time series plots of Anopheles sinensis human biting rates and time-variant predictors.
(A) Anopheles sinensis human biting rates (Box-cox transformed); (B) average temperature [AT]; (C) highest temperature [HT]; (D) minimum temperature [MT]; (E) cumulative precipitation [CPR]; (F) enhanced vegetation index [EVI]. The timeid in this figure indicates the order number of semimonth from June 2005 to October 2008. For example, 1 indicates the first half of June 2005; 11 indicates the first half of June 2006.

