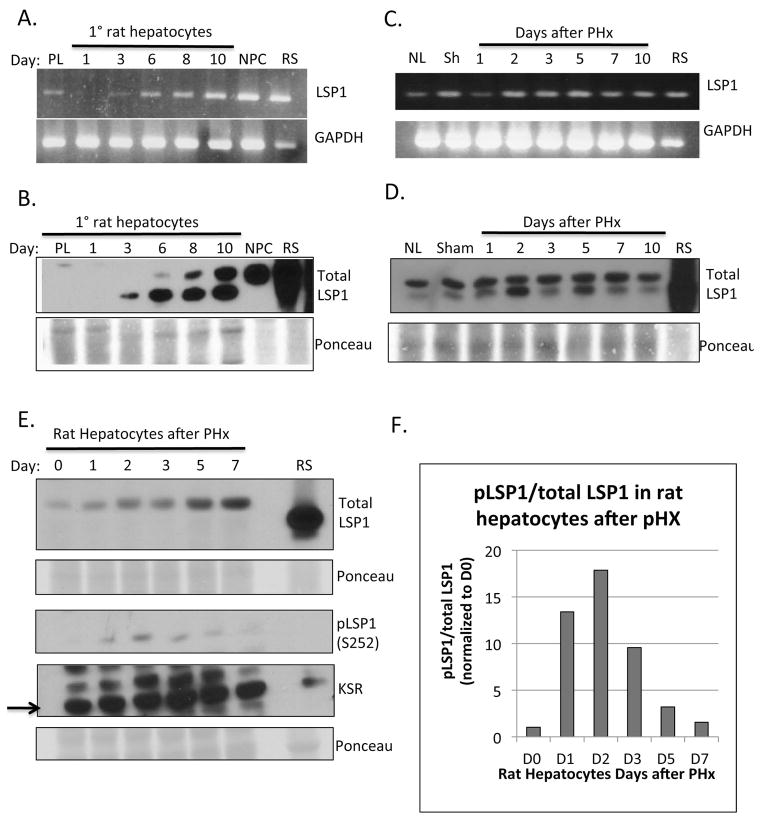
Figure 1. LSP1 expression in primary rat hepatocytes in culture, rat liver and hepatocytes after PHx.
Primary rat hepatocytes were cultured in the presence of HGF and EGF and harvested at various time points for A. mRNA expression using semi-quantitative RT-PCR (upper panel, LSP1 and bottom panel GAPDH as loading control), and B. protein expression by western blot (upper panel, total LSP1, bottom panel, Ponceau S stain, loading control). PL: Hepatocyte Pellet; NPC: Non-parenchymal cell fraction; RS: Rat spleen, used as positive control. Whole rat liver was harvested at various times after PHx and LSP1 expression was analyzed using C. RT-PCR (upper panel, LSP1, bottom panel GAPDH) and D. western blot of LSP1 (upper panel) and Ponceau S (bottom panel, loading control). NL: Normal whole liver lysate; RS: Rat spleen. Rat hepatocytes were isolated from liver after PHx by collagenase perfusion and analyzed by E. western blot for total LSP1 (upper panel), phophoLSP1 (S252) (3rd panel down) and KSR (4th panel down). F. Quantification of phosphoLSP1 to total LSP1 in the rat hepatocytes after PHx. For details of interpretation, see Results.

