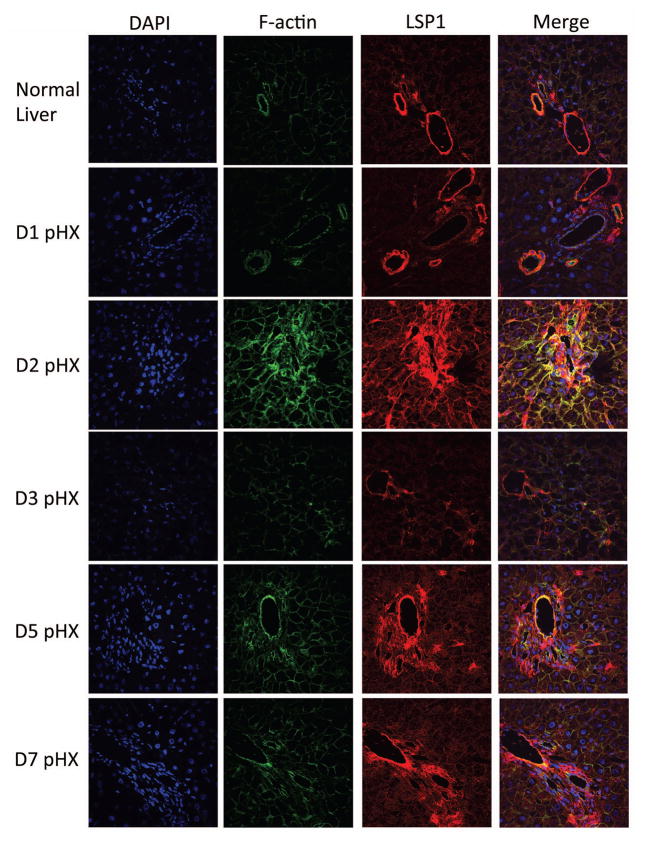
Figure 2. Immunofluoresence of LSP1 and F-actin in rat liver after PHx.
Rat liver was harvested at various time points after PHx and was probed for LSP1 and F-actin. First panel is DAPI to stain the nuclei, second panel shows the F-actin signal, third panel shows the signal for total LSP1 and the last panel displays a merge of the DAPI, F-actin, and total LSP1 signals. 600x magnification. For details of interpretation, see Results.

