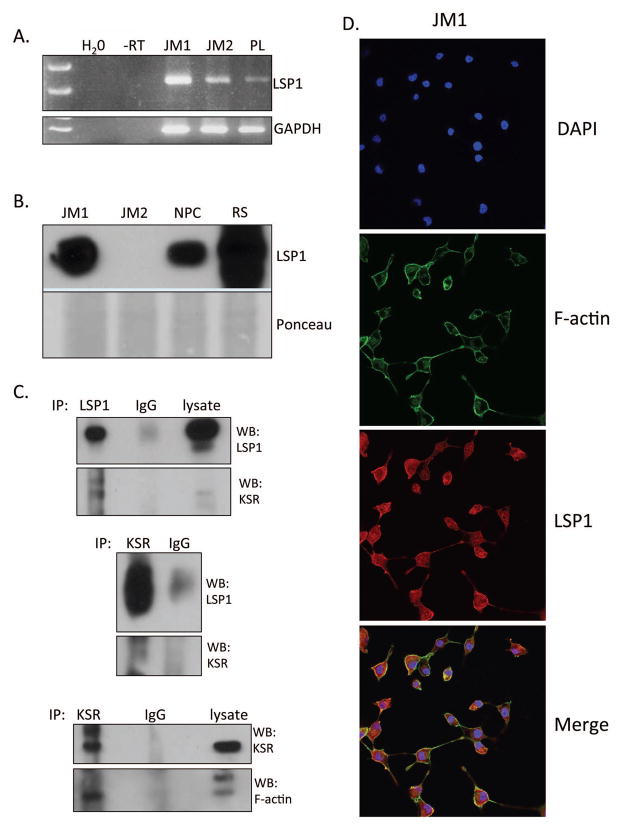
Figure 3. LSP1 expression in rat hepatoma cell lines and analysis of the interaction between LSP1, KSR and F-actin.
JM1 and JM2 cell line were analyzed for expression of LSP1 A. mRNA by RT-PCR and B. protein by western blotting. C. Co-immunoprecipitation analysis was performed using the JM1 cell line for interactions between LSP1, KSR and F-actin. Upper panel is an IP of LSP1 and western blot of LSP1 (top) and KSR (bottom). Middle panel is an IP of KSR and western blot of LSP1 (top) and KSR (bottom). Bottom panel is an IP of KSR and western blot of KSR (top) and F-actin (bottom). D. Immunofluorescence images of JM1 cells for DAPI (top panel), F-actin (2nd panel from top), LSP1 (3rd panel from top), and merge (bottom panel). Images were taken at 400x magnification.

