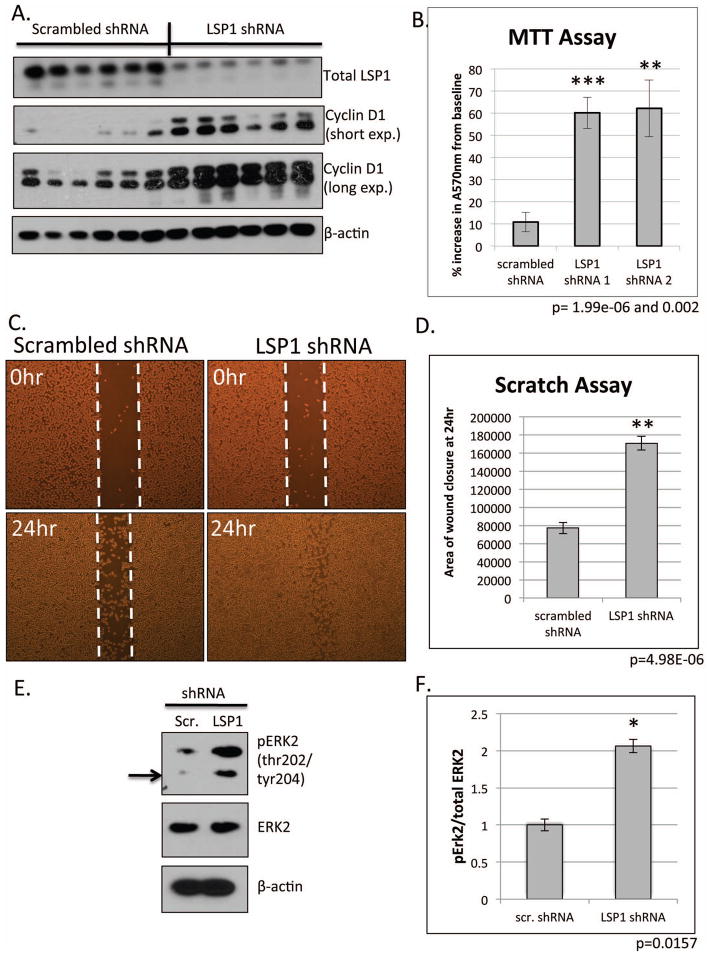
Figure 4. Functional analysis of loss of LSP1 expression in JM1 hepatoma cell line.
JM1 cells were transfected with LSP1 shRNA and a stable cell line was created. A. Western blot analysis of the stable LSP1 shRNA JM1 cell line for total LSP1 (top panel), cyclin D1 (2nd and 3rd panel), and β-actin (bottom panel, loading control). B. MTT assay of scrambled shRNA control cells and two LSP1 shRNA stable clones (LSP1 shRNA 1 and LSP1 shRNA 2). n=18 (experiment repeated at least two independent times), p=1.99e-06 and p=0.002, respectively. C. Representative bright field images of migration “scratch” assay at time 0 (upper panels) and 24 hours post scratch (bottom panel). D. Quantification of area of wound closure from scratch assay. n=6, p=4.98e-06. E. Representative western blot of phophoERK2 (top panel) and total ERK2 (middle panel) in JM1 LSP1 shRNA stable cell lines. F. Quantification of pERK2 and total ERK2. n=7, p=0.0157.

