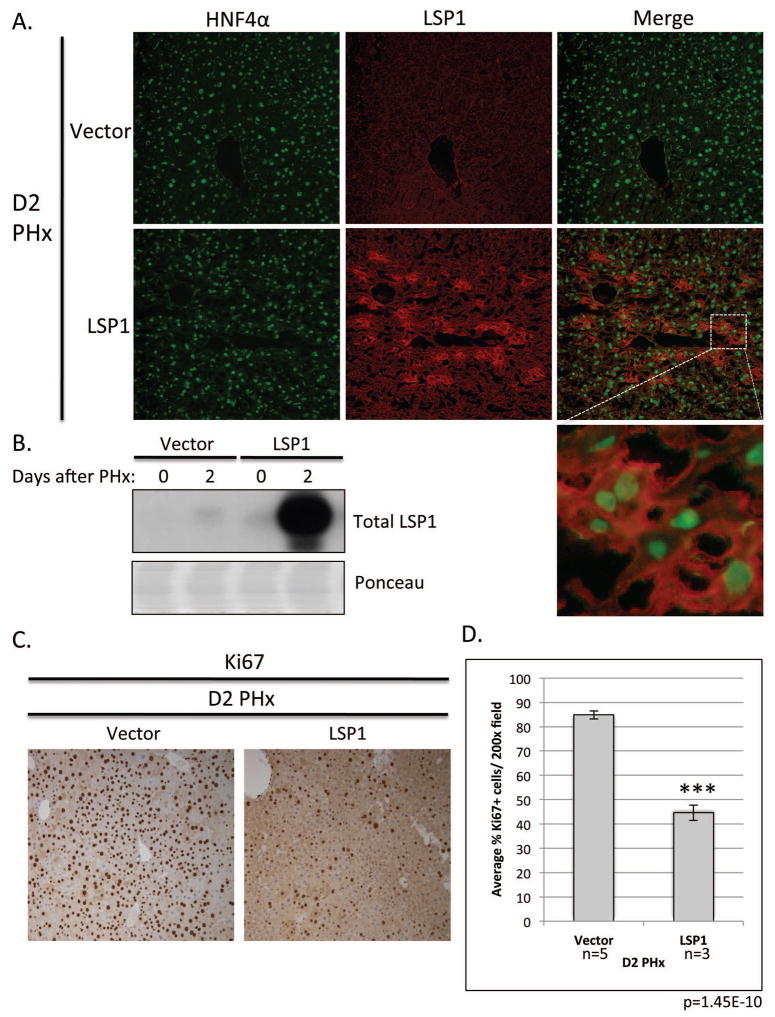
Figure 6. In vivo expression of LSP1 in a mouse PHx model.
Hydrodynamic tail vein injection was utilized to express LSP1 in vivo during PHx. A. Immunofluoresecence images of mouse liver at D2 after PHx (vector control (top panel), and LSP1, (bottom panel)) for HNF4α (left panel), LSP1 (middle panel), and merge (right panel). Images were taken at 200x magnification. Inset is shown to demonstrate LSP1 and HNF4α expression is present in the hepatocytes. B. Western blot analysis of total LSP1 expression (top panel) and ponceau (loading control) in total liver lysate from injected mice at Day 0 and 2 after PHx. C. Representative images of Ki67 staining of the injected mouse liver tissue on day 2 after PHx. Right image, vector control and left image, LSP1 injected animal. All images were taken at 200x magnification D. Quantification of the percentage of Ki67 positive hepatocytes in mouse liver tissue on D2 PHx. At least three random fields per slide were quantified using Image J software. Vector control mice n=5, LSP1 mice n=3. p=1.45E-10.

