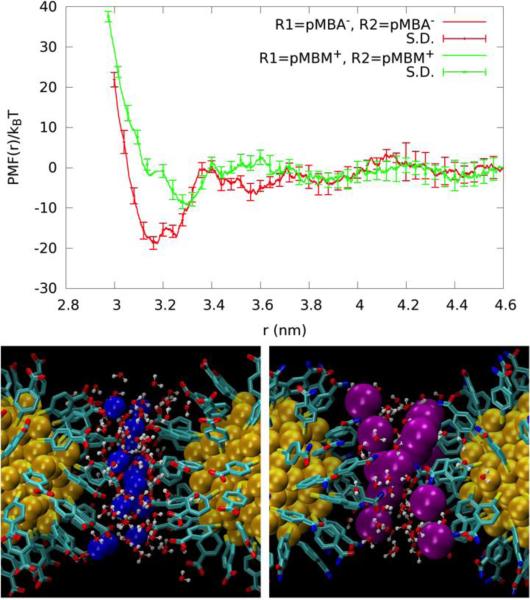
Fig. 10.
Top, the PMF profiles of the pMBA−-pMBA− (red) and pMBM+-pMBM+ (green) AuNP pairs as a function of the center-to-center distance between the cores. Bottom, the AuNP pairs positioned as at the well bottoms, r=3.2 nm for pMBA− pair (left) and r=3.3 nm for pMBM+ pair (right) respectively. Structure representation is identical to Fig. 9.

