
Figure 3. Representative pressure-volume loops during inferior vena cava occlusion at 3 months post myocardial infarction.
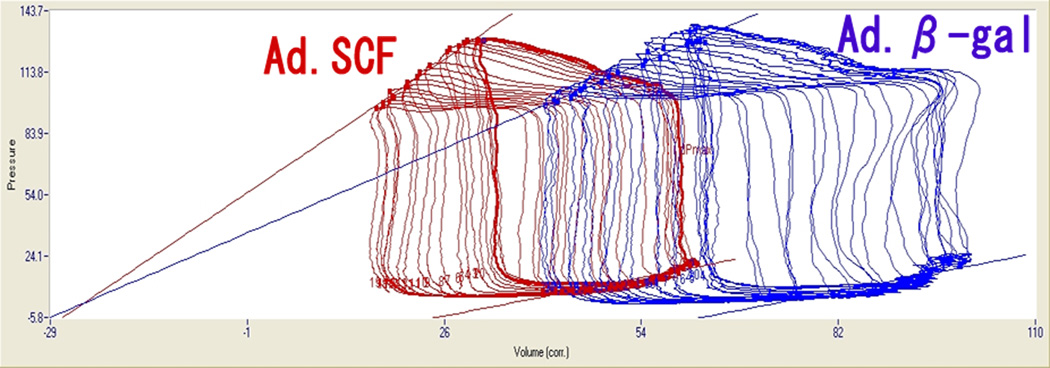
Left loop is from SCF treated pig and shows steeper end-systolic pressure-volume relationship with left ward shift relative to the right loop (Ad.β-gal).