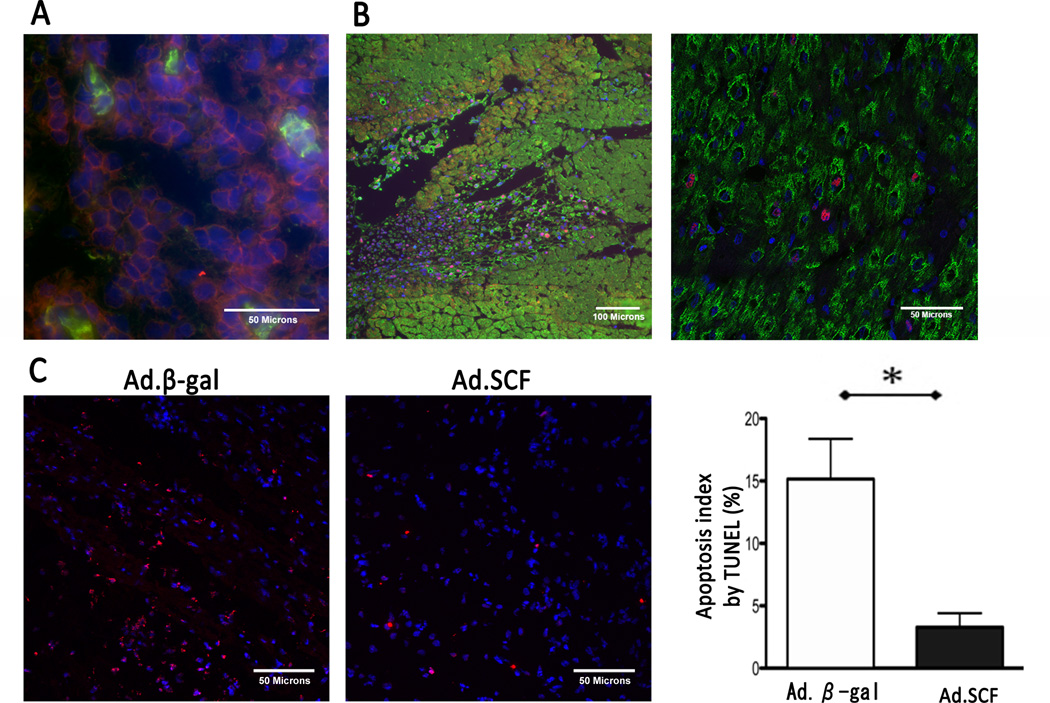
Figure 6. Characterization of infarct border zone 1 week after the gene transfer.
A. A few isolated c-kit+/CD45+ cells were found in clusters of c-kit+/CD45− cells. Blue; DAPI-stained nuclei, red; c-kit, green; CD45. B. Immunohistochemistry revealed increased PCNA expression at the injection site 1 week after gene transfer. Higher magnification image (right) shows that PCNA was expressed in both cardiomyocytes and non-myocytes. Blue; DAPI-stained nuclei, red; PCNA, green; α-sarcomeric actin. C. Representative examples of TUNEL staining and apoptosis index. Decreased apoptotic cells were found at the infarct border area after Ad.SCF injection (Apoptosis index: P<0.001). Blue; DAPI-stained nuclei, red; apoptotic nuclei. *; P<0.05

