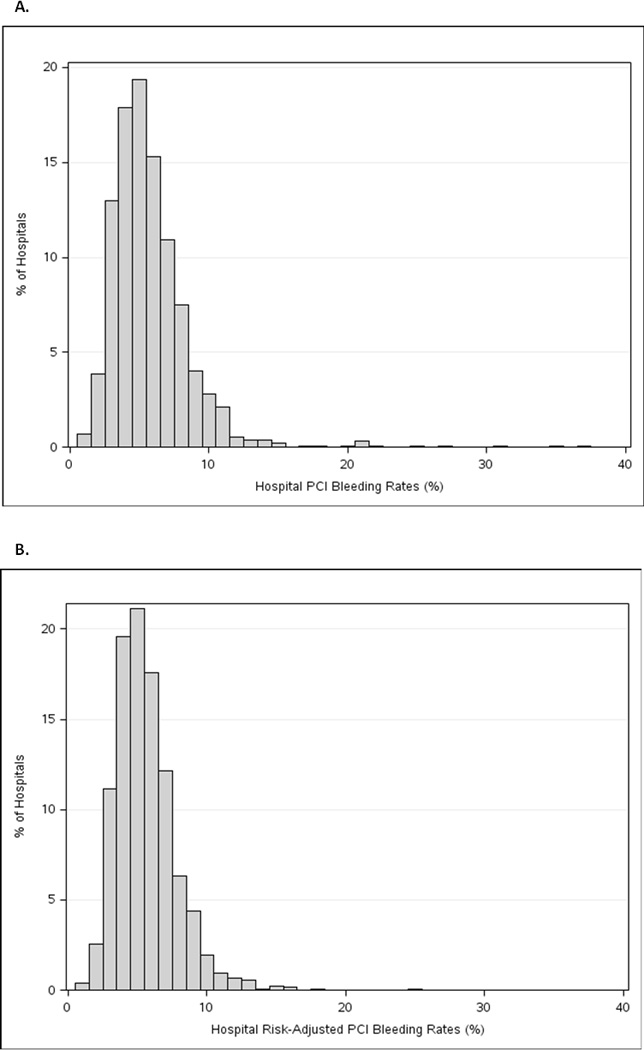
Figure 2. Distribution of Post-PCI Bleeding Among Hospitals.

This figure displays the distribution of post-PCI bleeding according to: (a) unadjusted bleeding rates; and (b) risk-adjusted bleeding rates using the revised CathPCI Registry bleeding model.
PCI indicates percutaneous coronary intervention
