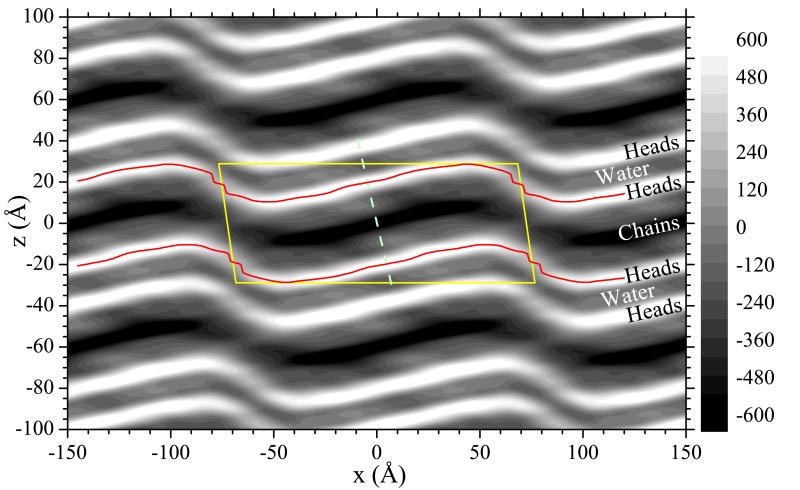
Fig. 4.
Unit cell is shown by yellow solid lines and the grayscale shows the electron density map (minus the average electron density) obtained from the experimental |Fhk| and the phase factors obtained from the best fitted model. The bright bands locate the electron dense headgroups and the thin red lines trace the local maxima in those bands. The darkest band locates the electron sparse terminal methyls on the hydrocarbon chains. The narrow band between the bright bands locates interlamellar water. The dashed line is drawn perpendicular to the major arm.

