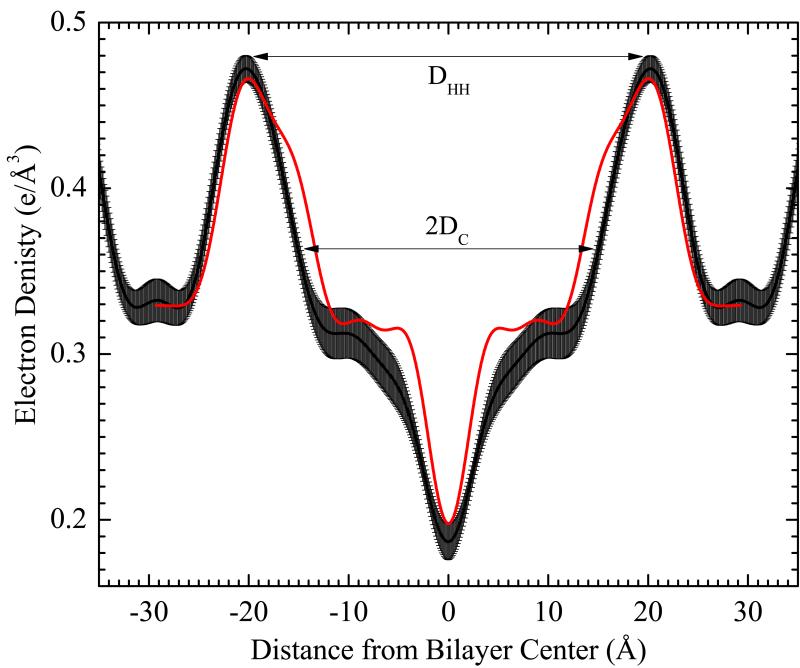
Fig. 5.
Electron density profile perpendicular to the major arm with error bands, obtained from averaging profiles at intervals of 10 Å in x. The dashed line in Fig. 4 shows the locus for the central profile. The red curve shows the corresponding higher resolution profile for DMPC gel phase at 10°c23 which we have used to scale the electron density axis for the ripple phase. The head-head thickness DHH = 40.6Å. The hydrocarbon thickness 2DC =30.7 Å.

