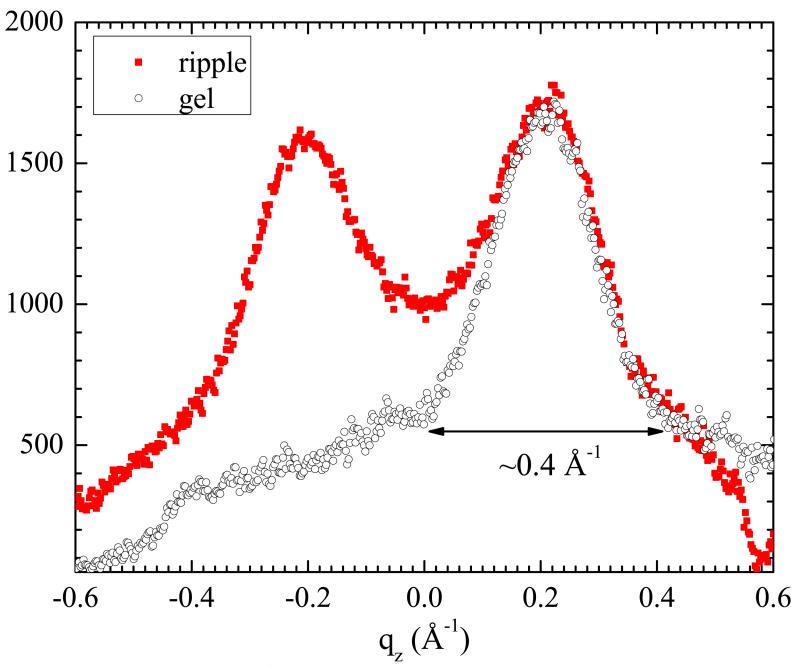
Fig. 7.
Red: tWAXS intensity in the qz direction along Bragg red I in the ripple phase (red) showing the breaking of the (2,0) and (−2,0) symmetry. Black: (±2,0) gel phase with the qz = 0 at the maximum intensity scaled and displaced for comparison to the ripple width. The arrow shows the width Δqz used in the text and Table 1.

