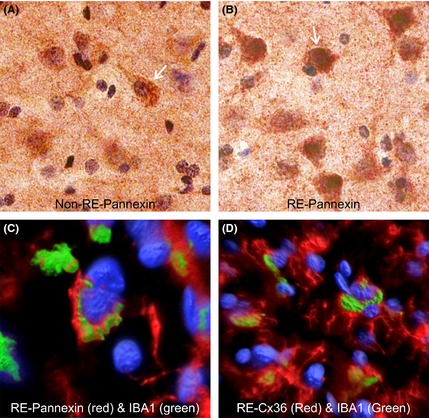
Figure 7.

Immunostaining for pannexin in representative non‐RE (A) and RE (B) cortical specimens, and double labeling for pannexin and IBA1 (C) and Cx36 and IBA1 (D) in RE tissue. (A and B) Staining against pannexin was localized to the cell bodies of pyramidal‐shaped cells and was denser in RE compared with the non‐RE case. (C) Double labeling of pannexin (red) and IBA1 (green; microglia) showed overlap supporting that areas of microglial activation were associated with pannexin expression in RE. Blue fluorescence is from DAPI staining. (D) Double labeling of Cx36 with IBA1 showed similar overlap as with pannexin.
