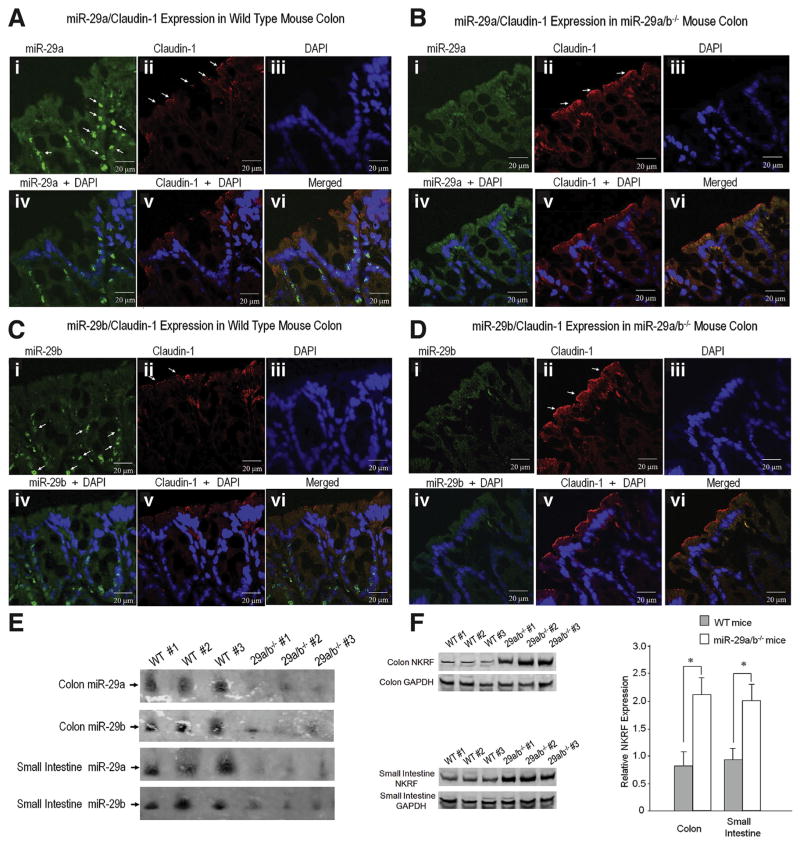
Figure 4.
Facilitation of intestinal barrier integrity in miRNA-29a/b−/− mice via CLDN1 and NKRF signaling network: Fluorescence in situ hybridization (FISH) was used to identify key target genes that regulate intestinal permeability in miR-29a/b−/− mice. (A) Shows FISH for miR-29a and its co-localization with CLDN1 expression in normal mouse colon (WT). (A-i) White arrows indicate miR-29a expression. (A-ii) shows immunohistochemical staining for CLDN1 in normal colon tissue. White arrows indicate CLDN1 expression. (A-vi) demonstrates co-localization of miR-29a expression and CLDN1 expression with 4′,6-diamidino-2-phenylindole (DAPI) staining. (B) Shows FISH analysis of miR-29a and its co-localization with CLDN1 expression in miR-29a/b−/− mouse colon. (B-i) shows a reduction in miR-29a expression in miR-29a/b−/− mouse colon compared with colon from WT mice (A-i). (B-ii) shows increased CLDN1 expression in miR-29a/b−/− mouse colon compared with WT mice (A-i). (B-vi) demonstrates co-localization of miR-29a expression and CLDN1 expression with DAPI in miR-29a/ b−/− mice. (C, D) show FISH for miR-29b and its co-localization with CLDN1 expression. (C-i) Shows miR-29b expression in WT mouse colon, the white arrows indicate miR-29b expression. There was an increase in CLDN1 expression (D-ii) in miR-29a/b−/− mice compared with WT mice (C-ii). (E) Northern blot that illustrates a decrease in miR-29a and miR-29b expression in miR-29a/b−/− mice compared to WT mice. (F) Illustrates Western blots of NKRF expression in colon and small intestine tissue. There was an increase in NKRF expression in miR-29a/b−/− mice (n = 3) compared with WT mice (n = 3) (*P < .05).

