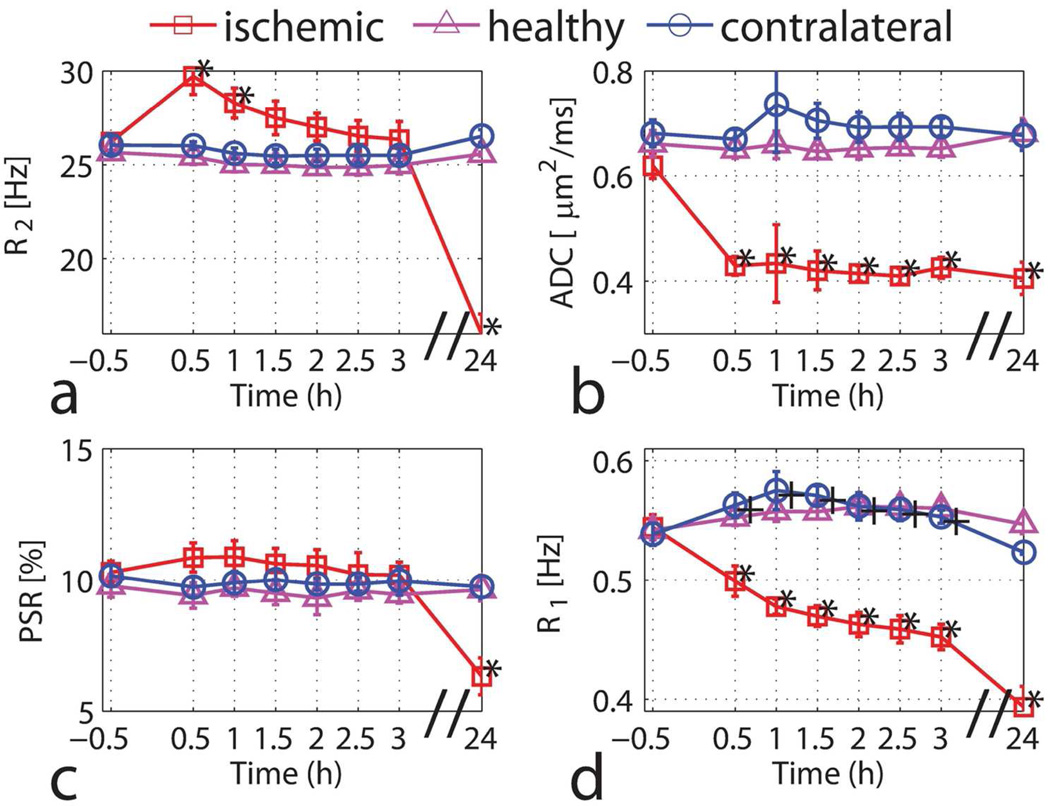
Figure 3.
Time-dependent values of R2 (a), ADC (b), PSR (c) and R1 (d) for the ischemic hemisphere (red squares), the contralateral hemisphere (blue circles) and the healthy controls (magenta triangles). Data are presented as mean ± s.d. (n=6). Statistical significances between pre- and post-MCAO were evaluated using the Wilcoxon rank-sum test (*P<0.01 for the ischemic hemisphere and +P<0.01 for the contralateral hemisphere).

