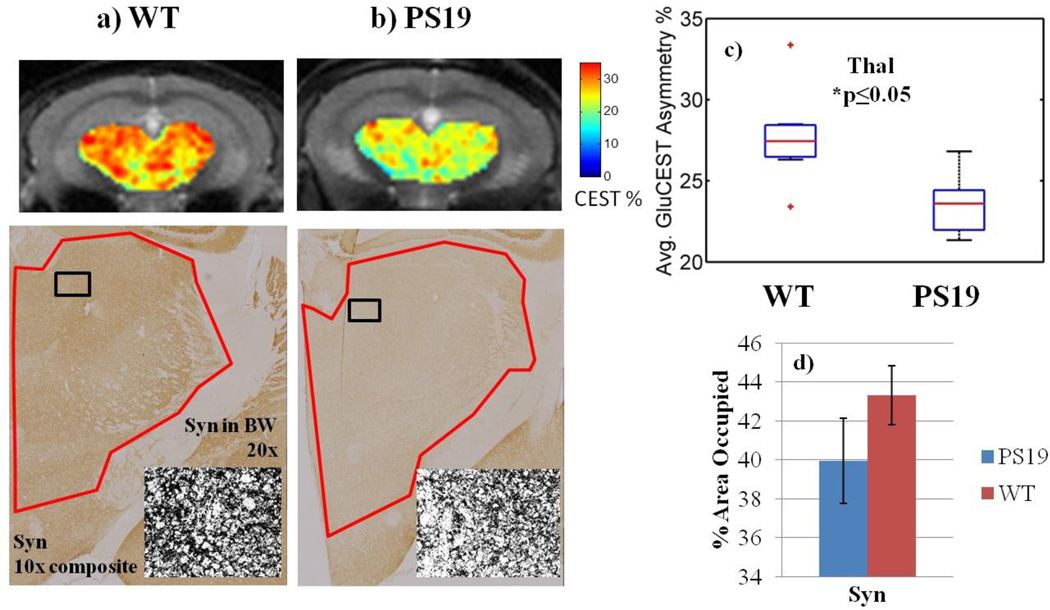
Figure 5. Comparison of GluCEST with synapse immunostaining in the thalamus.
a–b) Synapse immunostaining and corresponding GluCEST ROIs in the thalamus. The black and white inset shows less punctate staining in the PS19 thalamus.
c) Average GluCEST asymmetry of the thalamus (Thal) region is significantly decreased by 15% (p≤0.05) in PS19 mice compared to WT.
d) Synapse density shows a similar trend, decreasing 8%, although significance was not reached.

