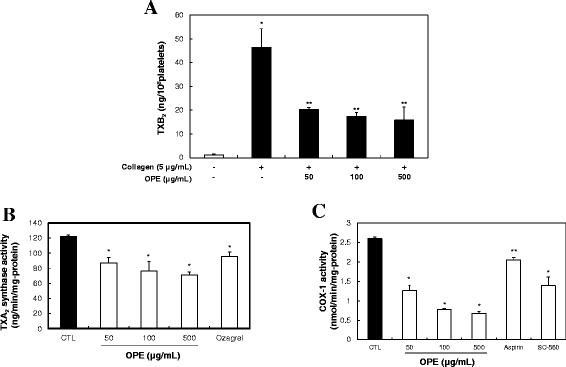
Figure 3.

Effects of OPE on TXA 2 formation. (A) TXA2 production by OPE. Data are expressed as mean ± SD (n = 3). *p < 0.05 compared with basal level. **p < 0.001 compared with that of collagen-induced platelets. (B) Effects of OPE on TXA2 synthase (TXAS) activity. Data represent mean ± SD (n = 3). *p < 0.05 compared with that of control. (C) Effects of OPE on COX-1 activity. Data represent mean ± SD (n = 3). *p < 0.001 and **p < 0.05 compared with that of control.
