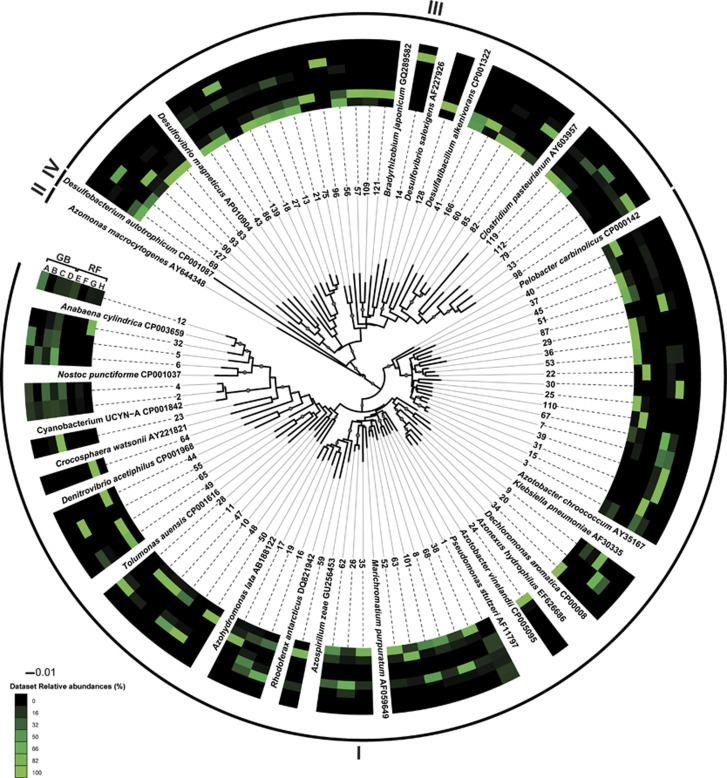
Figure 4.
Neighbor-joining tree of representative sequences from the 84 most abundant OTUs (each representing ⩾250 sequences) resulting from the 97% nucleotide sequence similarity clustering. Each of the OTUs are designated a number chosen by Mothur. Bootstrap values ⩾50% are represented by size-proportional gray circles in the tree. The heatmap indicates the relative abundance of sequences associated with a given OTU in each of the following types of samples: GB, RNA, <10 μm (A), GB, RNA, >10 μm (B), GB, DNA, <10 μm (C), GB, DNA, >10 μm (D), RF, RNA, <10 μm (E), RF, RNA, >10 μm (F), RF, DNA, <10 μm (G), RF, DNA, >10 μm (H). The affiliations of the OTUs with the canonical nifH clusters (Chien and Zinder, 1996) is indicated by roman numerals.

