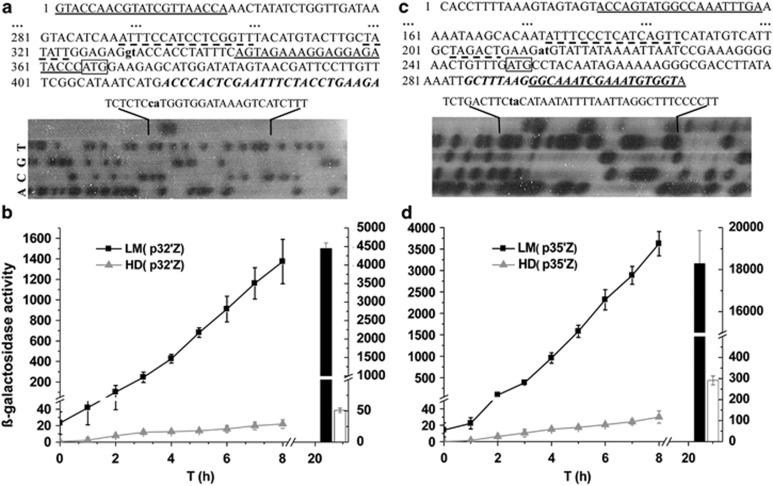
Figure 3.
Transcriptional analysis of LM1212 cry genes. (a and c) Sequence and primer extension analyses of cry32Wa1 and cry35-like promoters. Primers used for cloning the promoter regions are underlined and primers for extension experiments are indicated by black italics. Putative translation start codons are boxed and transcription start sites (TSSs) are noted with bold lowercases. The putative −10 and −35 regions of the promoters are indicated by dashed lines. The sequence extension results are noted above the gels and TSSs are shown with high black lowercases. (b and d) The activity of cry32Wa1 and cry35-like promoters as assessed by lacZ fusions. The columns on the right of the diagrams indicate the β-galactosidase activity of T20 (LM1212: black columns and HD73: white columns). Data are an average of three independent assays. Error bar is the s.d. Cells were cultured in SSM medium. T0 is the end of logarithmic growth and Tn means n hours after T0.

