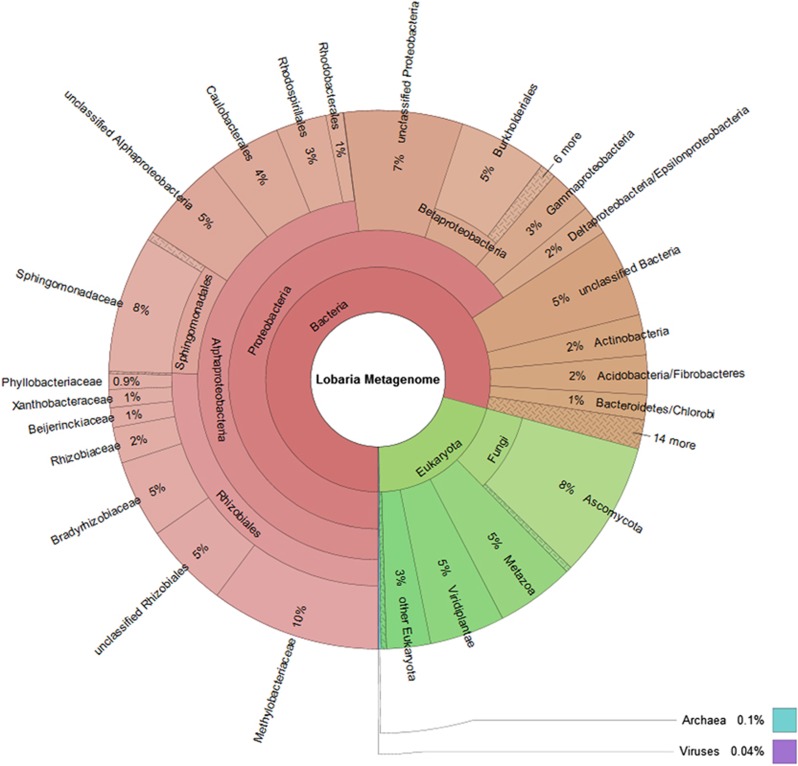
Figure 1.
Taxonomic spectrum visualized with Krona (www.krona.sourceforge.net/) of contigs in the metagenome for all domains of life. Circles represent taxonomic classifications in ascending order up to the family level (outermost circle). Less-abundant taxa are listed outside the charts together with their relative abundance.

