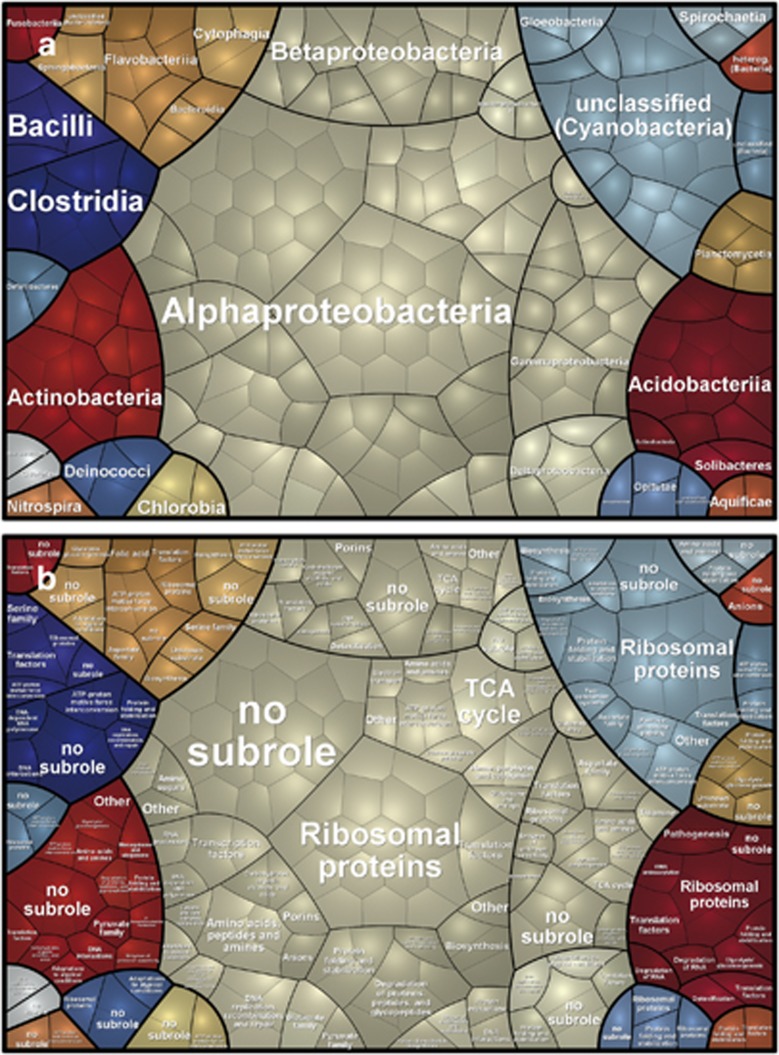
Figure 5.
Voronoi Treemap visualization of the prokaryotic metaproteome on the taxonomic (a) and functional (b) level. The taxonomic and functional distributions were carried out by Prophane 2.0. Taxonomic groups are indicated by different colors (a and b) and the functional classes are separated by black lines (based on TIGRRoles). Each cell represents at least one protein (or protein group) assigned to the respective phylum.

