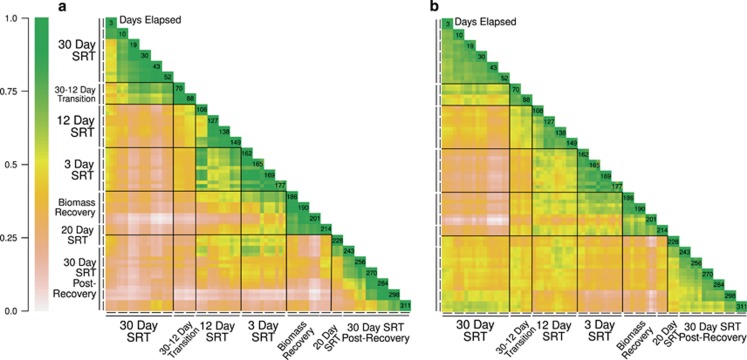
Figure 3.
Heatmaps displaying pairwise MH distances (a) and WU distances (b) for each sample date and corresponding SRTs. Values along unity indicate days elapsed from the start of the study. Values close to 1 (green-yellow) indicate high similarity, whereas values close to 0 (brown-white) indicate dissimilarity. Opposing side of each matrix is omitted for clarity.

