Figure 2.
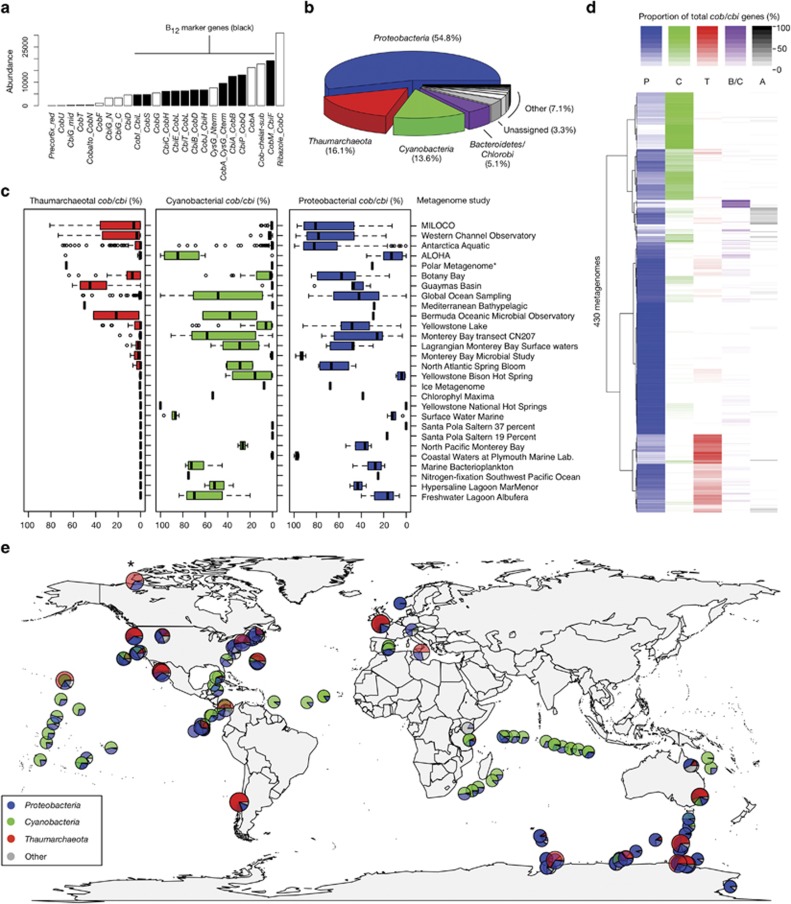
Survey of cobalamin synthesis genes across aquatic metagenomes. (a) The full set of cob/cbi genes and subset of eleven representative marker genes (black) used in the screen and their abundance (total number of detected genes). (b) Taxonomic breakdown of all detected cob/cbi genes across 430 aquatic metagenomes. (c) Distributions of thaumarchaeotal, cyanobacterial and proteobacterial cobalamin gene contributions (% of total cob/cbi genes) for 28 different studies. (d) Clustering and heatmap visualization of taxonomic composition of cob/cbi genes for the 430 metagenomes. The color scale reflects the proportion of cob/cbi genes in each sample affiliated with a particular taxonomic group. More information on each sample can be found in Supplementary Table S1. (e) Global distribution of cobalamin synthesis genes. To emphasize Thaumarchaeota-rich metagenomes, data points with higher thaumarchaeotal contributions have been slightly enlarged and overlayed preferentially in cases where there are overlapping data points. The Thaumarchaeota-rich Arctic metagenome described in the text is indicated by an asterisk.

