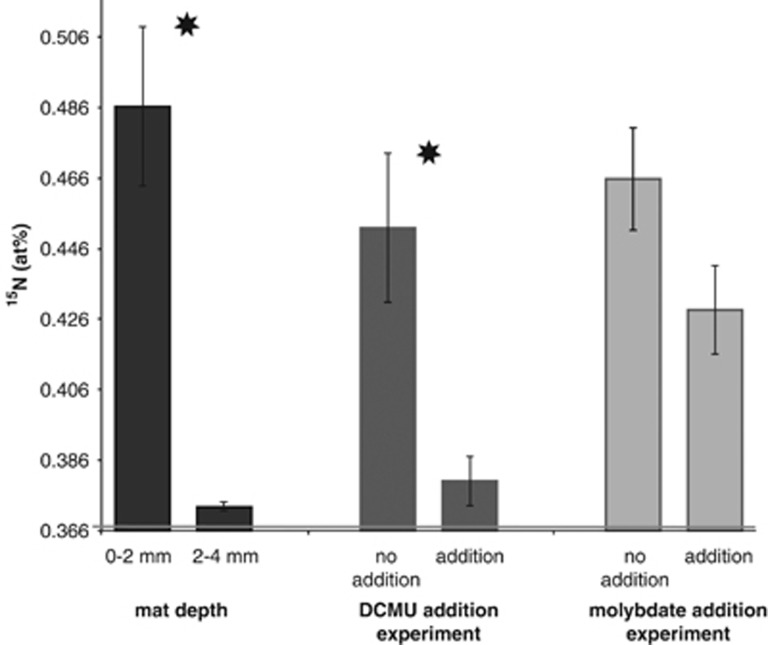
Figure 2.
15N enrichment (at%) of mat cores that were incubated with 15N2 for 10 h in the dark measured by IRMS. Average values of three biological replicates per treatment are depicted with standard errors (for ‘0 to 2 mm depth', n=10). Asterisks indicate significant different paired treatments at P<0.05. Natural abundance of 0.37 at% 15N is indicated by a gray horizontal line.

