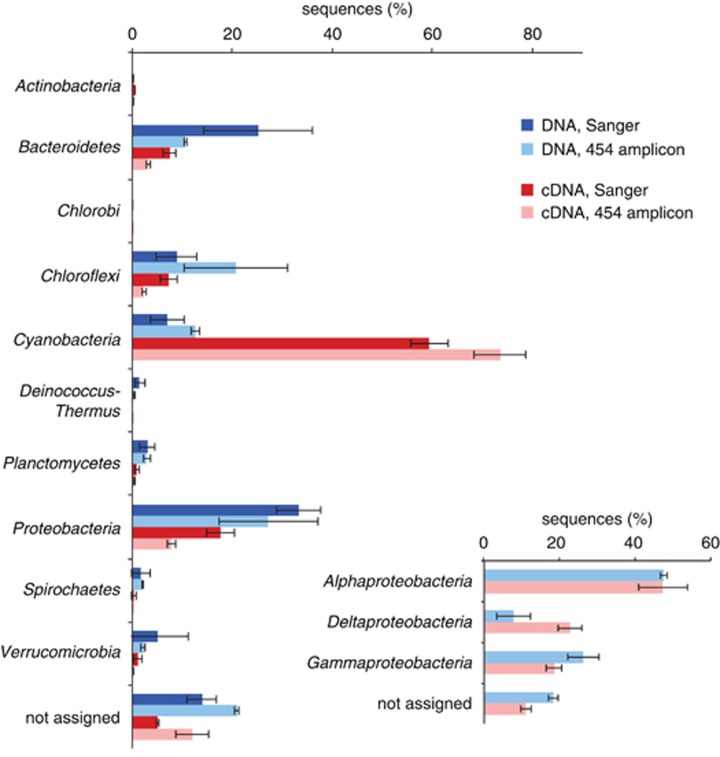
Figure 3.
Microbial community analysis based on 16S rRNA gene and transcript sequencing of the upper 2 mm of intertidal mats at Laguna Ojo de Liebre. Phyla depicted are those that contain ⩾0.1% of sequences detected by either Sanger sequencing (dark blue and dark red bars) or 454 amplicon sequencing (bars in light blue and light red). Each bar depicts the average value of 2 biological replicates. Both approaches illustrate a diverse community based on DNA analysis, with most of the sequences grouping within Proteobacteria, Bacteroidetes, Chloroflexi and Cyanobacteria. Sequences based on cDNA are strongly dominated by Cyanobacteria (up to 74% of the sequences), followed by Proteobacteria, Bacteroidetes and Chloroflexi. Inlet depicts proteobacterial community composition based on 454 amplicon sequences (sequence abundance of Alpha-, Delta- and Gammaproteobacteria within the Proteobacteria).

