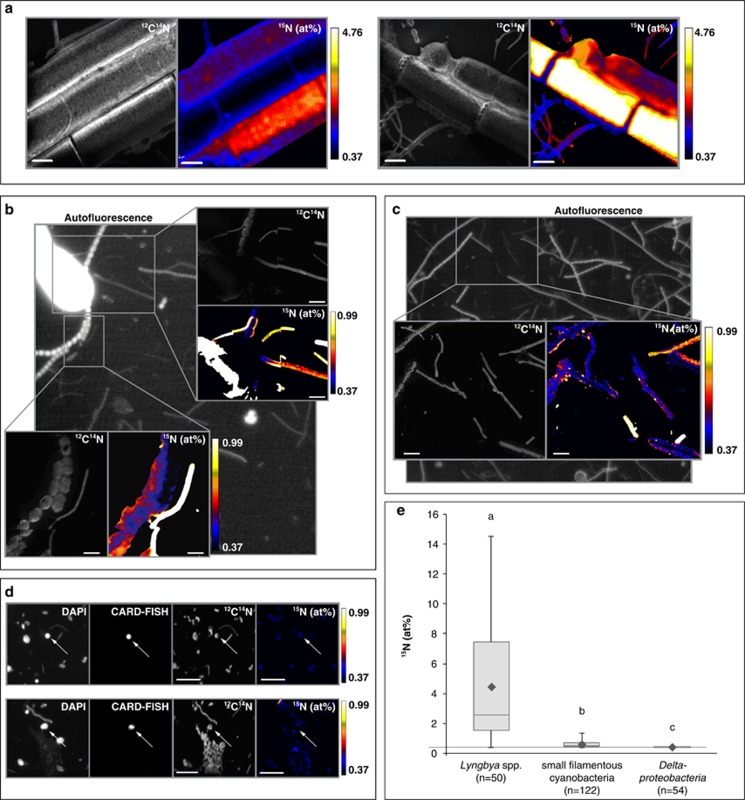
Figure 5.
Single-cell isotope measurements by NanoSIMS of 15N2-incubated mat samples from Laguna Ojo de Liebre. (a) Elemental composition images (12C14N and 15N at%) of Lyngbya spp. filaments. However, as described in Supplementary Information, image analysis of Lyngbya spp. was not suitable for quantitative analysis of these large cells (instead isotope enrichment measurements were done by accelerated sputtering utilizing high primary ion beam currents (∼1 nA, 2 μm beam size)). Therefore, 15N isotopic composition depicted in these images will be an underestimation of the actual enrichment in 15N. (b, c) Epifluorescence micrograph and elemental composition images (12C14N and 15N at%) of analyzed small filamentous cyanobacteria. Filamentous cyanobacteria were identified based on their autofluorescence. (d) NanoSIMS analysis of Deltaproteobacteria. Epifluorescence micrographs depict cells stained by DAPI and deltaproteobacterial cells stained by CARD-FISH (with probe-mix DELTA495 a–c). Also depicted are elemental composition images (12C14N and 15N at%). (e) Boxplot diagram summarizing all measurements of the three cell types. The number of cells (or individual filaments) analyzed per cell type are indicated. 15N enrichments are depicted in at% natural abundance is 0.37 at% (indicated by a horizontal line). Lowercase letters indicate significantly different isotopic compositions between different cell types. Deltaproteobacteria were not significantly enriched in 15N relative to controls (average of 0.38 vs 0.37 at% 15N, P=0.170). The highest 15N enrichment measured in an individual deltaproteobacterial cell was 0.41 at%. Also when 15N dilution through CARD-FISH is accounted for, the deltaproteobacterial 15N isotope fraction values increase only slightly, and their corrected values are still not significantly enriched above natural abundance values (average of 0.38 at% 15N, P=0.131). We also considered the individual measured values (as opposed to the population mean), and found that based on the uncorrected values, 20.4% of the cells are significantly enriched in 15N based on a 95% confidence interval. This number increases to 31.5% if the dilution through CARD-FISH is taken into account. Scale bars represent 5 μm. Please note the different scales for 15N at% values.

